Use of opioids—U.S.
Estimates from the 2013 National Survey on Drug Use and Health (NSDUH) indicate that about 681,000 persons ages 12 or older used heroin in the past year. This constitutes an 83% increase from 2007 when only 373,000 individuals reported past year use. The misuse of opioid prescription drugs is much more common. NSDUH data from 2013 indicate that about 11.1 million persons ages 12 or older nationwide used pain relievers nonmedically in the past year – a statistically significant decrease from 2012 when close to 12.5 million reported past year use. Among this group, over 1.4 million people ages 12 or older (0.5%) reported past year nonmedical use of the drug OxyContin. Additionally the survey found that 681,000 persons (0.3%) ages 12 or older used heroin in the past year and approximately 11.1 million persons (4.2%) ages 12 or older used pain relievers nonmedically in the past year.1
The misuse of opioid prescription drugs is much more common.
- Opioid pain relievers (also known as opioid analgesics) are among the most common drugs taken by adults ages 20–59.2
- Sales of these drugs quadrupled between 1999 and 2010.3
- The amount of opioid pain relievers prescribed in 2010 has been estimated to be enough to medicate every American adult with a standard pain treatment dose of 5 mg of hydrocodone (e.g., Vicodin) taken every 6 hours for 45 days.4
Hospitalizations—U.S.
Data from SAMHSA’s Drug Abuse Warning Network (DAWN) indicate that in 2011, opioid pain relievers were involved in 420,040 drug-related visits to the Emergency Department (ED), compared with 258,482 visits linked to heroin.5 A review that also used data from DAWN found that the highest number of ED visits for nonmedical use of prescription drugs in 2004-2008 were due to the opioid prescription drugs oxycodone, hydrocodone, and methadone.6 This pattern was also true of the 2011 DAWN data, with 175,229 of the roughly 420,000 ED visits associated with oxycodone products, 97,183 with hydrocodone products, and 75,693 with methadone.5
Deaths—U.S.
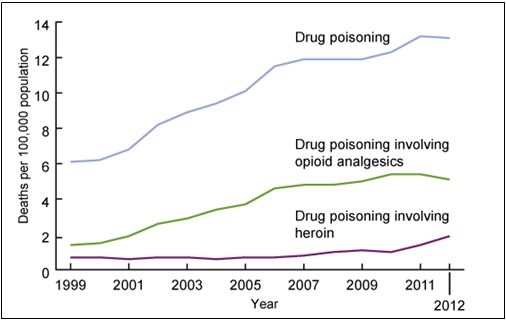
The number of overdose deaths in the U.S. increased every year from 1999 (16,849 cases) to 2012 (41,502 cases). In 2012, 39% of overdose deaths were attributable to opioid analgesics (16,007) and 14% were attributable to heroin (5,925).7 Between 2011 and 2012, the age-adjusted rates for overdose death involving opioid analgesics decreased by 5% from 5.4 per 100,000 to 5.1 per 100,000 – the first decline since 1999. In contrast, the age-adjusted rate of overdose deaths involving heroin increased 35% between 2011 (1.4 per 100,000) and 2012 (1.9 per 100,000) – the highest rate since 1999.8
Age-adjusted drug-poisoning death rates: United States 1999-20128